- Saturday, 30 May 2026
India dominates the series stats; Gill, Rahul boss the control numbers

Photo: Times of India
By S Rajesh, ESPNCRICINFO, Aug 7: A 2-2 scoreline looks fair for an incredibly hard-fought series. All Tests save the second one at Edgbaston were close, and the India team and their fans would have felt hard done by had the series ended 3-1, given that they dominated most of the post-series stats tables: their batters averaged 39.77 to England's 37.57, scored 12 hundreds to England's nine, and their players occupied four of the top six spots for run-scorers and wicket-takers.
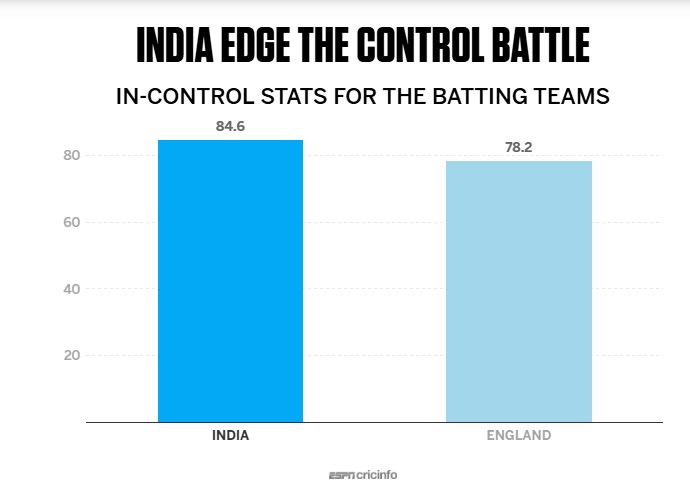
Another metric that India dominated was the control percentage - a measure of how many errors the batters made. This is measured as a binary in ESPNcricinfo's ball-by-ball scoring system - a ball middled or left alone is marked in control, while those where the batter edged, or was beaten or dismissed is marked not in control. On this metric too, India were ahead: in control of 84.6% of the deliveries they faced, compared to 78.2% for England's batters.
A couple of clarifications are needed at this point. Firstly, while control is marked as a binary in the scoring system, some false shots present a greater wicket-taking opportunity/threat than others: a batter leaving a delivery heading towards the stumps has obviously made a far greater error than one who gets struck on the pads while missing a delivery going down leg. However, for the purpose of this exercise, all errors are the same.
Secondly, given England's aggressive approach to batting, they tend to play more false shots than batters from other teams. A higher percentage of these mistakes usually occurs when looking for runs: in this series, for example, only 29.6% of England's errors came when defending, compared to 38.8% for India. Why this approach works for England was explored in some depth on ESPNcricinfo in 2023; essentially, they try to maximise the runs scored off deliveries that they are in control of, so that the total runs scored per false shot is greater than that of the opposition. At the same time, with fields getting more defensive due to their aggressive approach, they also get away with more false shots, allowing them to get away with more errors per dismissal. Since runs per dismissal is a product of those two factors, higher numbers in each of those is a winning formula for England, despite a lower control percentage.
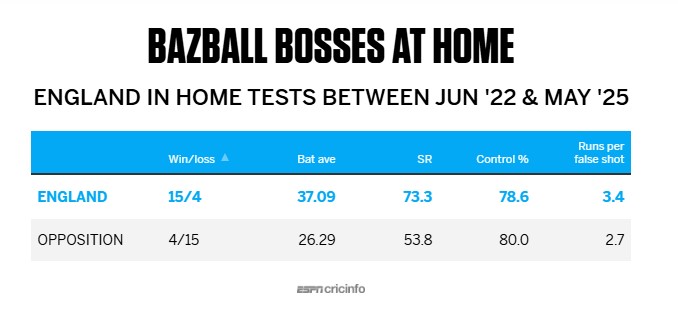
Over the last 20 home Tests of the Bazball era before the latest series, England followed that template and reaped rich rewards. Despite achieving a 15-4 win-loss record in those 20 Tests, their control percentage of 78.6 in those matches was marginally lower than the opposition's 80. However, their strike rate when in control was a staggering 81, and that ensured that they scored more runs per false shot than their opponents - 3.43 to 2.69. They also had a higher false-shot-per-dismissal factor - 11 compared to 9.95. Those two numbers ensured a higher-runs-per-dismissal ratio, which is usually the most important stat in cricket.
The story was the same in the 2023 Ashes, which also ended in a 2-2 draw. The difference in control stats was similar to the England-India series - 82.1% for Australia, 75.9% for England - but England scored 3.1 runs per false shot to Australia's 2.9. Their ultra-aggressive approach, illustrated by a strike rate of 82.4 from in-control deliveries compared to Australia's 53.5, ensured that the risk-reward equation still worked in their favour despite a much lower control percentage.
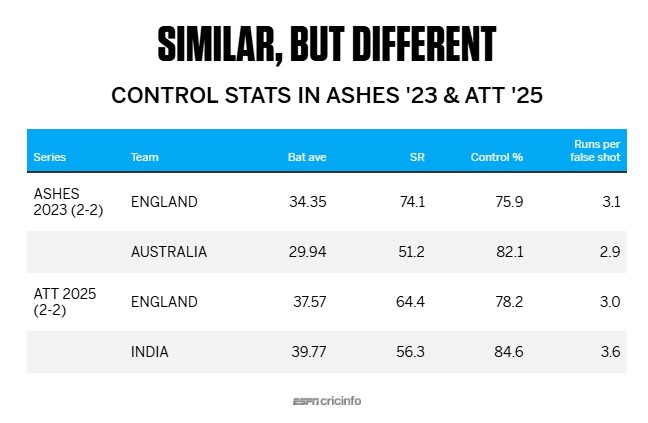
In this home series against India, that wasn't the case. As mentioned earlier, India were ahead in the control stakes, 84.6 to 78.2, much like the 2023 Ashes. However, England scored fewer runs per false shot than their opponents this time - 3.0 to India's 3.6. That's largely because they didn't score quite as quickly off the in-control deliveries, striking at 71.8. That was still more than India's 59.2, but much lower than the Ashes 2023 strike rate of 82.4.
In other words, they didn't compensate for the extra errors by adding more runs when they were in control. In fact, their overall batting strike rate of 64.43 was the third-lowest in 11 Bazball series (excluding one-off Tests), and almost 10 runs lower than the 74.14 they achieved in the 2023 Ashes. They still got away with more false shots per dismissal than India, 12.7 to 11.1. But despite that, for the first time in six home series since Bazball began, England scored fewer runs per wicket than their opponents.
Gill and Rahul - the control masters
Apart from Shubman Gill scoring more runs than anyone else, he was also the most assured batter across both teams, with a control percentage of 90. KL Rahul, who also had an exceptional series with 532 runs, was the only one who was close at 88.5. B Sai Sudharsan's returns - 140 runs in six innings - didn't reflect the assurance he showed at the crease, achieving a control percentage of 86.8. Karun Nair had similar returns - 205 runs from eight innings - but his control percentage was only 80.26, which indicates a more troubled time at the crease for him.
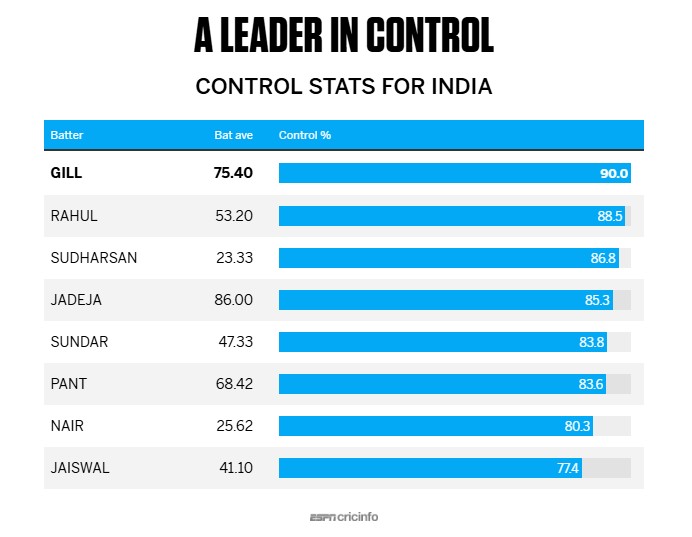
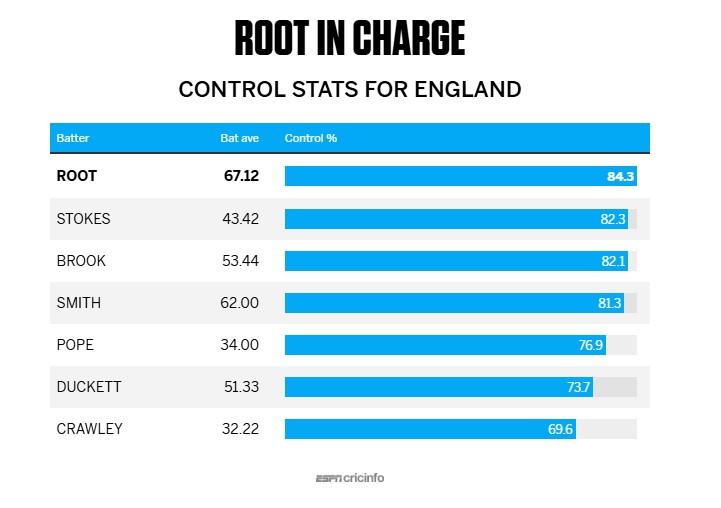
Rahul's control percentage was especially impressive since he opened the innings, given that none of the three other openers in the series achieved a control percentage of 80. Yashasvi Jaiswal managed 77.3, Ben Duckett 73.7 and Zak Crawley only 69.6. The control numbers are also indicative of the brand of cricket they play: Rahul's game is steeped in orthodoxy, reflected in the series strike rate of 49.9, while Duckett (series strike rate 82.9), Jaiswal (68.7) and Crawley (62.1) are all more aggressive and unorthodox. Joe Root was England's most in-control batter with a percentage of 84.3, while Ben Stokes, Harry Brook and Jamie Smith also topped 80.
The bowlers who forced the most mistakes
Over the course of the entire series, bowlers elicited a false shot from 18.2% of the total deliveries bowled, which converts to one every 5.5 balls. For fast bowlers, it improved to 20.7%, or once every 4.8 deliveries. Bowlers took a wicket every 11.9 false shots, a number which was more or less constant across pace and spin.
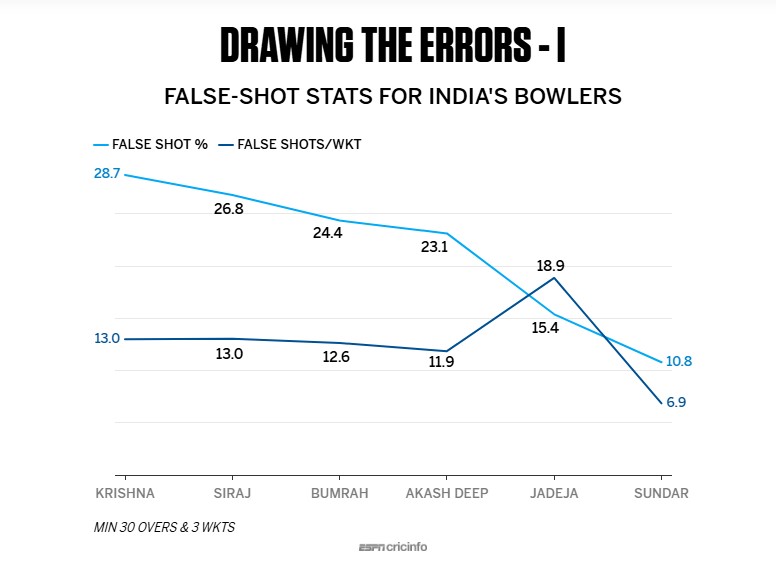
Given that India's batters had a higher control percentage, it's obvious that their bowlers drew a higher percentage of false shots from England's batters - 21.8%, compared to 15.4% for England's bowlers. Four of India's pace bowlers drew false-shot percentages of over 20, led by Prasidh Krishna's 28.7 and Mohammed Siraj's 26.8. Both, though, averaged 13 false shots per wicket, which was higher than the series average of 11.9.
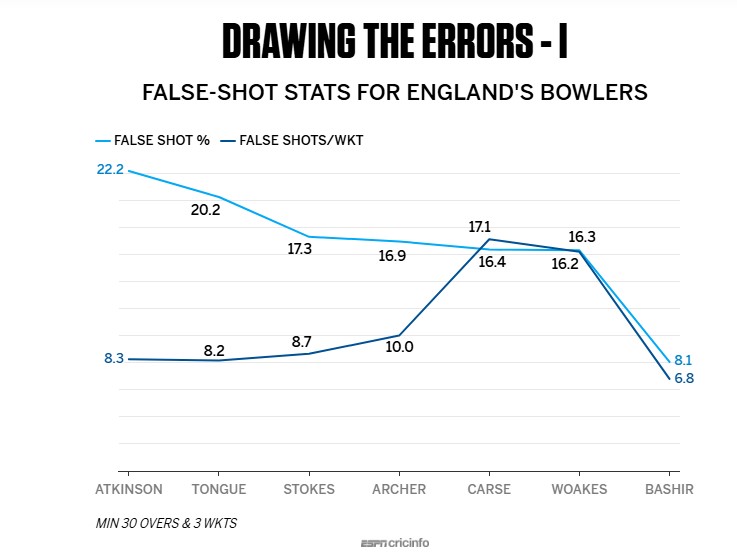
Among England's bowlers, Gus Atkinson was hugely impressive in the one Test he played, forcing false shots off 22% of the deliveries he bowled. Despite some wayward spells, Josh Tongue boosted his bowling stocks too with 19 wickets in three Tests, and a false-shot percentage of 20.3.
Stokes drew a smaller percentage of false shots, but the ratio of false shots to dismissals was excellent for him, as it was for Tongue and Atkinson. For Brydon Carse and Chris Woakes, though, the series was forgettable - both averaged over 50, with relatively low false-shot percentages and high ratios of false shots per wicket. Their strike-rates were among the worst four for an England seamer bowling at least 150 overs in a home series in the last 30 years.
Bowlers vs the top five opposition batters
India had five batters who scored 400-plus runs at 40-plus averages: Gill, Rahul, Rishabh Pant, Ravindra Jadeja and Jaiswal. Similarly, England had five who averaged over 40, but with a lower qualification of 300 runs: Root, Duckett, Smith, Brook and Stokes. Here's a look at how the opposition bowlers performed in their battles against these specific batters.
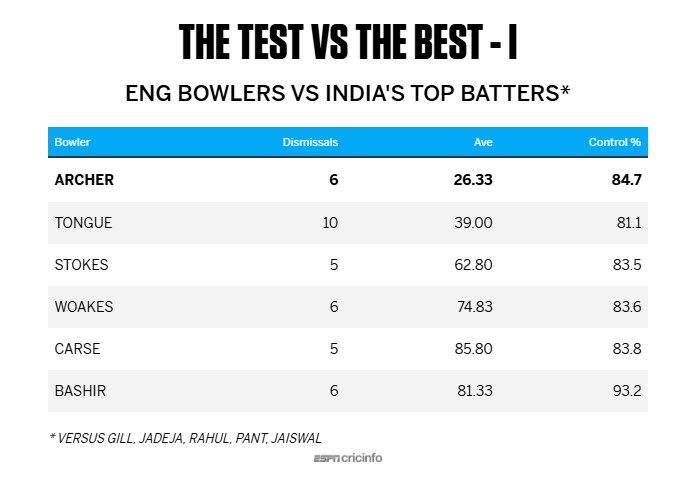
Against the Indian top five, Jofra Archer was the only one to average under 30, thanks to his record against Jaiswal (six runs, two dismissals) and Pant (35 runs, two dismissals). Rahul was superb against him (50 runs, 136 balls, 0 dismissals, 92.6% control), while Gill and Jadeja fell to him once each. Tongue averaged under 40 against them, but the rest conceded more than 60 runs per dismissal against these five, indicating how dominant the batters were.
However, the collective control percentage for these batters against each of the fast bowlers was remarkably similar, in the early 80s. Archer got his six wickets from 50 false shots, but Woakes induced as many as 134 false shots for the same returns.
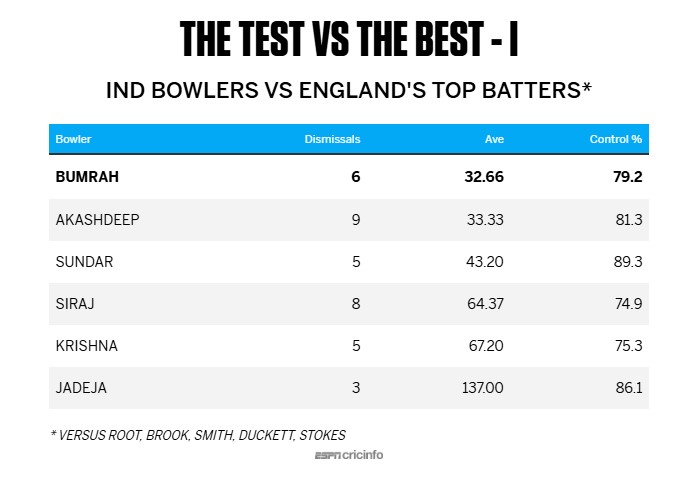
Among the Indian bowlers, Jasprit Bumrah and Akash Deep had excellent numbers against England's five best batters, averaging under 35 runs per wicket, but only eight of Siraj's 23 wickets came against them, at an average of 64.37. It isn't as if he didn't trouble them, inducing as many as 171 false shots against them, which is reflected in a control percentage of under 75%. Bumrah induced 81 false shots for his six wickets, Akash Deep 79 for nine, but Siraj had to toil a lot harder. Finally, on the very last day of the series, Siraj got his richly deserved returns for all the work he had put in earlier.


-original-thumb.jpg)
-square-thumb.jpg)


-original-thumb.jpg)